


 SMT Prospects and Perspectives: AI Opportunities, Challenges, and Possibilities, Part 1
 Nolan’s Notes: Do More, Get More
 Global Sourcing Spotlight: Don’t Be Afraid of Global Sourcing
Divergence in Test Results Using IPC Standard SIR and Ionic Contamination Measurements
August 1, 2016 | Karen Tellefsen, Alpha Assembly SolutionsEstimated reading time: 8 minutes
Controlled humidity and temperature controlled surface insulation resistance (SIR) measurements of flux covered test vehicles, subject to a direct current (DC) bias voltage, are recognized by a number of global standards organizations as the preferred method to determine if no-clean solder paste and wave soldering flux residues are suitable for reliable electronic assemblies. The Association Connecting Electronics Industries (IPC), Japanese Industry Standard (JIS), Deutsches Institut fur Normung (DIN) and International Electrical Commission (IEC) all have industry reviewed standards using similar variations of this measurement.
Ionic contamination testing is recognized by the IPC as a standard for evaluating the cleanliness of assemblies that have been subjected to a cleaning process. IPC J-STD001F calls for a cleanliness level of
IPC-TM-650 Method 2.3.25 contains standard test methods for extracting contaminants from circuit boards using heated isopropanol (IPA) / water mixtures. Test method 2.3.25 is commonly referred to as the ROSE (resistivity of solvent extract) test. Previous work1,2 has shown poor correlation between the presence of extractable, corrosive weak organic acids and results from IPC-TM-650 2.3.25 test results, partially due to the lack of solubility of materials found in no-clean fluxes, and the higher SIR values imparted by rosins and resins in modern no-clean soldering materials.
This study will compare the results from testing two solder pastes using the IPC-J-STD-004B IPC TM-650 2.6.3.7 surface insulation resistance test and IPC TM-650 2.3.25 in an attempt to investigate the correlation of ROSE methods as predictors of electronic assembly electrical reliability.
Introduction
Ionic contamination testing has been traced back to work done at the United States Naval Avionics Center in Indianapolis in the early 1970s by Hobson and DeNoon3. This work eventually led to the development of the 1.56 µg/cm2 (10 µg/inch²) NaCl equivalent standard for ionics extracted using an IPA/water mixture. High volume circuit assembly at the time used only wave soldering processes, employing foam fluxers to apply RMA flux followed by a post soldering cleaning process with fluorocarbon solvents.
This ionic contamination limit became part of now defunct Mil Spec P-288094 and Mil STD-2000A, but has been carried through versions A through F of ANSI/J-STD-001. This manual procedure has become more automated with the invention of descriptively branded test equipment such as the Contaminometer, Ionograph and Omega Meter. Although these measuring devices improve the efficiency and accuracy of measuring ionic contamination soluble in alcohol/water mixtures, they also increase the amount of ionic material measured5, 6.
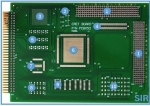
IPC-9202 describes a procedure for qualifying a process for electrical reliability by measuring SIR using IPC TM-650 2.6.3.7 and IPC TM-650 2.3.28 by using the IPC-B-52 test coupon. This coupon is shown in Figure 1. The standard calls for a minimum SIR value of 100MΩ, but only calls for a measure and report of the ionic contamination. The reported ionic contamination then becomes a benchmark for “future trouble shooting or process improvement efforts.”
The experiments carried out in this work were designed to use methodology derived from IPC-9202 to determine if it is possible to have a solder paste that passes SIR standard of >100 MΩ, but fails the ionic contamination level of ANSI/J-STD-001f, and determine if a second solder paste fail the SIR test and pass the ROSE test standard.
Figure 1: IPC B-52 test coupon comprising a SIR test coupon (SIR) and a section for ionic contamination measurements (SIR). Component ID: 1 – TH connector 4 x 24 pins; 2 – Capacitor, 10 pF, 0402 package; 3 – BGA, 256 IO, 1 mm pitch, isolated; 4 – SM connector IEEE 1386, 2 x 16 pins; 5 – Capacitor, 10 pF, 0805 package; 6 – QFP160, 0.65 mm pitch, isolated; 7 – QFP80, 0.5 mm pitch, isolated; 8 – Capacitor, 10 pF, 0603 package; 9 – SOIC16, 1.27 mm pitch, isolated; 10 – Capacitor, 10 pF, 1206 package.
Methodology
Two different SAC305 solder pastes were printed and reflowed on IPC B-52 test coupons (Figure 1). The assembled coupons were broken into two separate test vehicles after the solder pastes were printed, populated and reflowed. The section of the board on the center right was used to measure ionic contamination. The left portion of the test vehicle was used to measure SIR. The four smaller panels on the far right were discarded. A schematic diagram of the Ionograph that was used is depicted in Figure 2. The Ionograph is considered a “dynamic” ROSE measurement in which the extraction solution is continuously passed through ion exchange columns that remove the ionic material in the solution. A conductivity bridge detects ions in solution, and a flow meter measures the volume of solution passing by the conductivity bridge, allowing ionic contamination to be integrated with extraction solution volume.
A second measurement using three IPC-B-24 coupons (usually used for single material SIR measurements) for each of the two pastes was made.
Figure 2: Schematic diagram of the “Ionograph.”
Page 1 of 4
Share on:


Suggested Items
Real Time with... IPC APEX EXPO 2024: Exploring IPC's PCB Design Courses with Kris Moyer
04/18/2024 | Real Time with...IPC APEX EXPOGuest Editor Kelly Dack and IPC instructor Kris Moyer discuss IPC's PCB design training and education offerings. They delve into course topics such as design fundamentals, mil/aero, rigid-flex, RF design, and advanced design concepts. They also highlight material selection for high-speed design, thermal management, and dissipation techniques. The interview wraps up with details about how to access these courses online.
IPC Bestows Posthumous Hall of Fame Award to Industry Icon Michael Ford
04/18/2024 | IPCIPC honored the late Michael Ford, Aegis Software, for his extraordinary contributions to the global electronics manufacturing industry with the IPC Raymond E. Pritchard Hall of Fame Award at IPC APEX EXPO 2024. IPC’s most prestigious honor, the Hall of Fame Award is given to individuals who have provided exceptional service and advancement to IPC and the electronics industry. Ford, an industry leader and valued IPC volunteer, died suddenly in January 2024.
Two Industry Rising Stars Recognized at IPC APEX EXPO 2024
04/17/2024 | IPCTwo of the industry’s best and brightest were presented with an IPC Rising Star Award at IPC APEX EXPO 2024 in recognition of their leadership roles and support of IPC standards, education, advocacy, and solutions to industry challenges. Award recipients were Naim Kapadia and Michael Schleicher.
Two Long-time IPC Volunteers Receive Dieter Bergman IPC Fellowship Award
04/17/2024 | IPCThe Dieter Bergman IPC Fellowship award was presented to two IPC volunteers at IPC APEX EXPO 2024. The award recipients have fostered a collaborative spirit, made significant contributions to standards development, and have consistently demonstrated a commitment to global standardization efforts. Tiberiu Baranyi and Zhiman Chen were chosen as award recipients as they embody the work ethic and spirit of the late Dieter Bergman, an industry pioneer and icon. As part of the award, they bestowed Dieter Bergman Memorial Scholarships to the university or college of their choice.
Real Time with... IPC APEX EXPO 2024: MYCRONIC's Evolution and New Solutions
04/17/2024 | Real Time with...IPC APEX EXPOHenry Crandall interviews Kevin Clue, the vice president of global sales for MYCRONIC's High Flex division. They discuss the company's evolution, emphasizing its strong customer relationships and its role as a versatile, turnkey solution provider. Kevin unveils new solutions launched at IPC APEX EXPO, including an AI-integrated inspection system and the A40 pick-and-place platform. The conversation also touches on the increased use of AI and deep learning.